Reports in Zoho Projects includes options such as, Gantt chart, Resource utilization charts, and Zoho Reports across all projects for a particular user. Furthermore, you can get a bird's eye view of all tasks / milestones completion status across projects within minutes.
Gantt chart is a visual representation of the project schedule. It displays information about the various tasks such as task progress, task owner, task status and other task details. In Zoho Projects, you can view the Gantt chart in two different views:
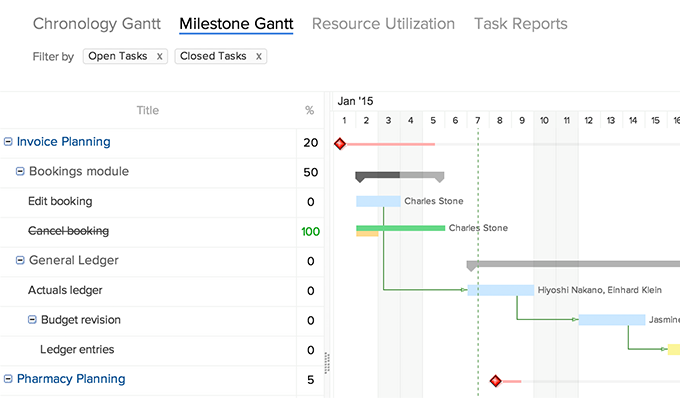
Milestone Gantt: Milestones, Task lists and Tasks are displayed based on their hierarchy in the project. Milestones are represented as a red rhombus, and Task lists as black horizontal bars and Tasks in various colors as horizontal Gantt bars.
Chronology Gantt: Gantt bars are displayed based on the order of the start date in the project. Tasks and subtasks are represented in various colors as horizontal Gantt bars.
Note:
Click Tasks, and click Reports & Gantt Charts to view the Chronology Gantt, Milestone Gantt, Resource Utilization chart, and Task Reports for the selected Project.
-or-
In the Home section, click Reports & Gantt Charts , to view the Chronology Gantt, Milestone Gantt, Resource Utilization chart, and Zoho Reports across all projects.
In the Chronology Gantt, you can view tasks based on their sequence in the project. You can view the task and subtasks Gantt bar.
Note:
Filter tasks based on Period, Status, and Task Owner.
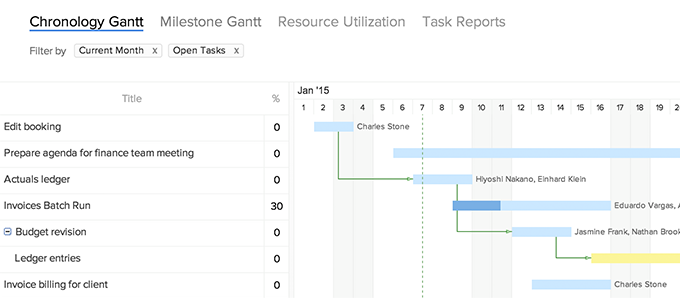
In the Chronology Gantt you can edit task, set dependencies, print, and convert the chart to pdf. You can convert the chart to pdf based on the following choices available:

The Bring bar into view option brings the Gantt bar for the selected task into the Gantt chart view. This option is available in both the Milestone Gantt and Chronology Gantt.

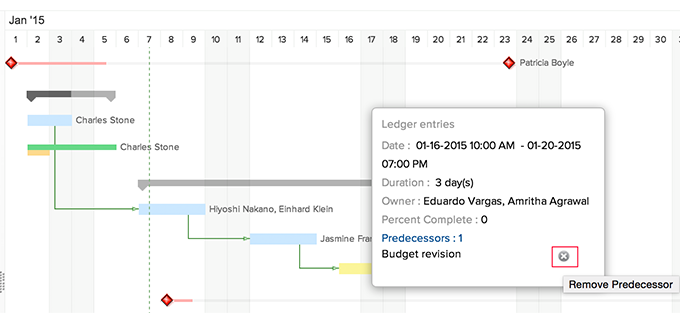
Click Remove Predecessor, to remove the predecessor tasks right within the Gantt chart itself. This option is available in both the Milestone Gantt and Chronology Gantt.
In the Milestone Gantt view, you can view the Milestones, Task lists and Tasks on the left and the corresponding bars on the right that shows the time span required. You can view Gantt charts based on a filtered criterion. Also, you can save the filter settings of the chart, even after you navigate to another view and comeback to view this chart.
Note:
Filter tasks based on Project or Milestone, Milestone Status, Milestone Owner, Task status, and Task Owner.
Click on any task and edit, right within the Milestone Gantt.

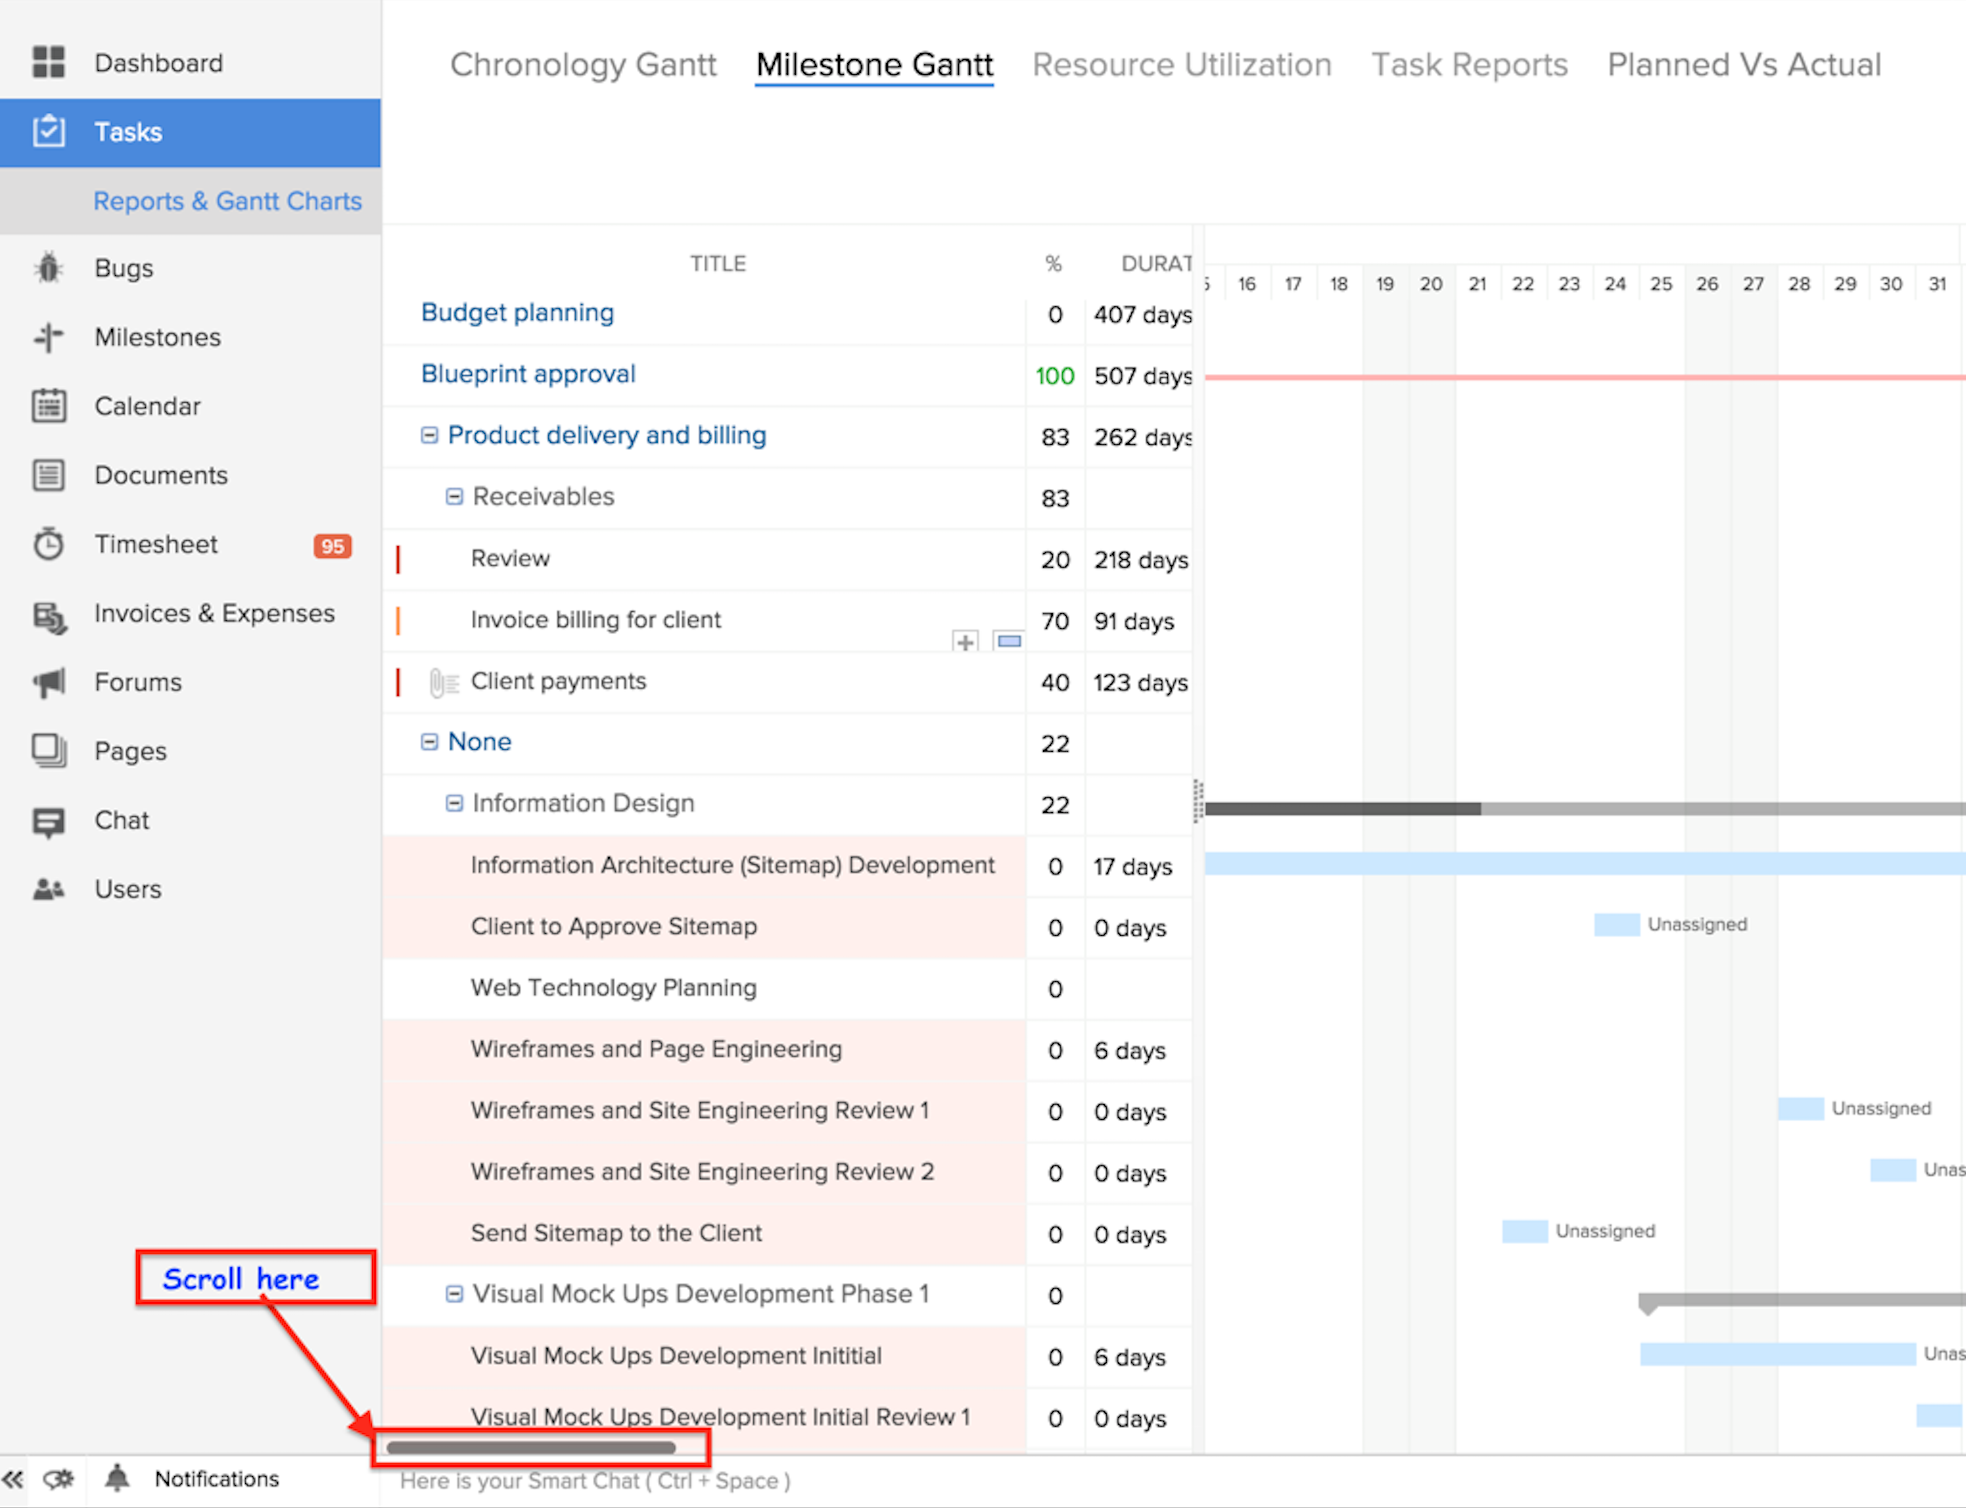
On the left side, at the bottom of the Gantt chart, scroll right to view other task details like Completed percentage, Duration, Start Date, End Date, and Owner. You can also see the completed percentage of Milestone and Task list.
Set dependencies between tasks by dragging a line between the dependent task and its predecessor task.
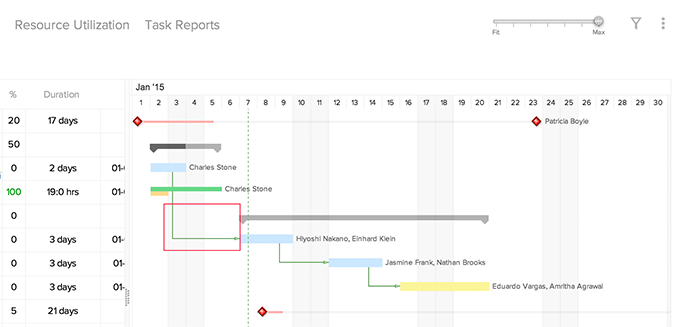
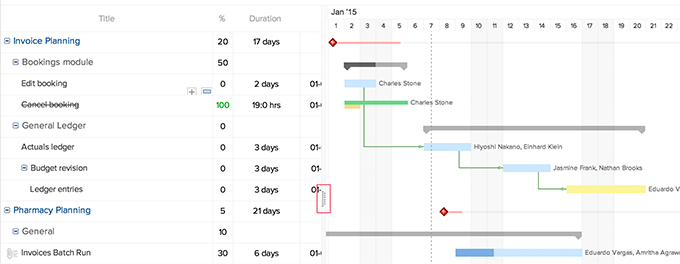
Resize the panel width of the chart based on your convenience and view more task details such as Completed Percentage, Duration, Start Date, End Date, and Owner.
Print the chart and convert to pdf, if required. Also, Collapse All Task lists and Expand All Task lists in the Milestone Gantt. You can convert the chart to pdf based on the following choices available:

Note:
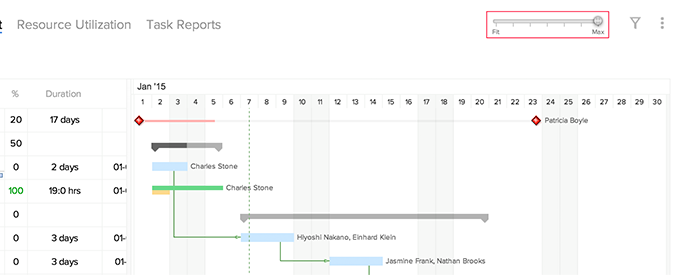
You can click Max to maximize the Gantt bar or click Fit to fit their width and rescale the chart.
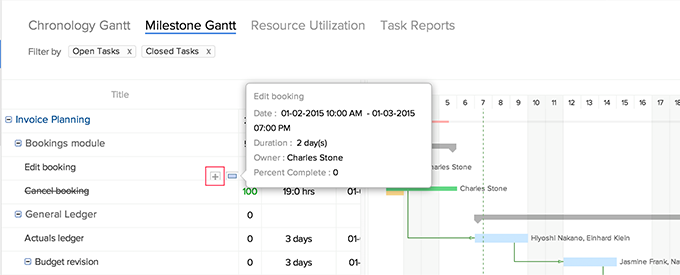
Move the mouse pointer over any task to enable the Insert Task option and then click the Plus icon to add a new task above the respective task or sub task. And the new task or sub task inserted is always at the same task level.
In Reports & Gantt Charts, click Resource Utilization to view the chart.
-or-
Click Tasks, and click Reports & Gantt Charts, and then click Resource Utilization to view the chart.
The Resource Utilization gives an overview of how your team member's time is being utilized. With Zoho Projects you can achieve complete visibility into resource utilization and track over allocation, idle and optimum allocation of tasks.
It visually shows the allocated work in hours and percentage. You can easily find out if a work exceeds the business hours or is within the business hours or equalizes the business hours. The idle time is also reflected. If a resource is over allocated you can manage the over allocated work for that resource by dragging the task bar to another resource or another day with available business hours. You can directly add tasks on the chart for any selected user and search for any resource using the Search Users option.

Filter the resource chart based on User, Period, Allocation type, Work Time Unit, and Task Status. And select the Save this Filter checkbox to save the filtered criterion. This saved filter is permanently available even after you sign out or navigate between tabs; it is applied across all the projects in the portal. However, if you don't opt to save the filter, it will be temporarily available until the page is refreshed.
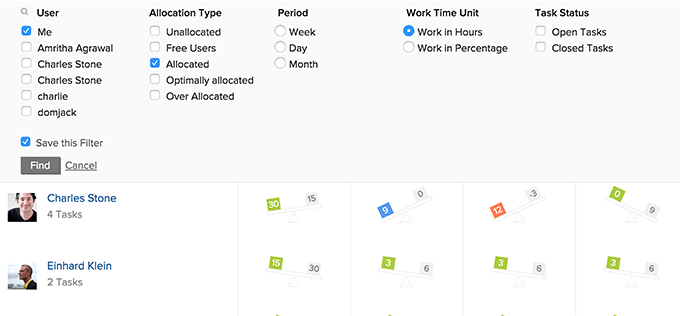
Plus you can also convert the chart to a pdf file using the Convert to pdf option at the top right corner next to Filter.
The recurring tasks are displayed virtually in both the Gantt and Resource utilization charts based on their recurring frequency. Only the recurring task that is active is displayed as task bar, whereas the remaining recurring tasks are displayed in dotted lines, just as a reminder for your convenience about the project schedule.

You can edit only the active recurring tasks; the virtual recurring tasks cannot be edited. And neither can you perform any actions on those virtual tasks.

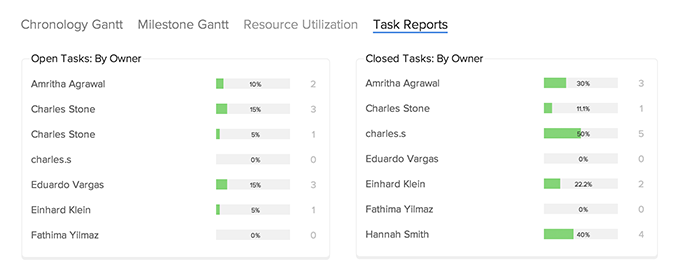
Task reports view provide a consolidated view of all the tasks in a project based on their status, priority and owner. Click Tasks> Reports & Gantt Charts, and then click Task Reports tab to view the task reports.
Task Reports, display a consolidated view of the tasks and milestones based on the task status and milestone. In addition, you can also get user based tasks report. Click on the individual link to display a task summary report based on users / priority / status.
Tasklist | Tasks | Subtasks | Copy / Move tasks | Task Dependency |