Overview
Zoho Creator supports creation of powerful reports to visualize your data in multiple formats that cater to specific business needs. The Report Builder provides an intuitive drag-and-drop interface to drilldown the existing reports in your ZC application and visualize them as Pivot Tables and Pivot Charts. You can create multiple reports based on a single form or report. By default, all your reports will be placed under the Reports tab.
- Pivot Tables allow you to create a powerful view with data summarized in a grid, both in horizontal and vertical columns (also known as Matrix Views or Cross Tabs). Multi-level pivots can be created by specifying multiple fields to the column, row and data axis.
- Pivot Charts A pivot chart is an interactive graphical representation of the data in your Zoho Creator application. You can rearrange the layout, select a different type of chart, and add or remove data. A Pivot Chart can also create a quick summary of text entries. For example if you have a list of products sold, create a Pivot Chart to show the percent of the total sales for each product.
Create a Pivot Table
1. Steps to create a pivot table
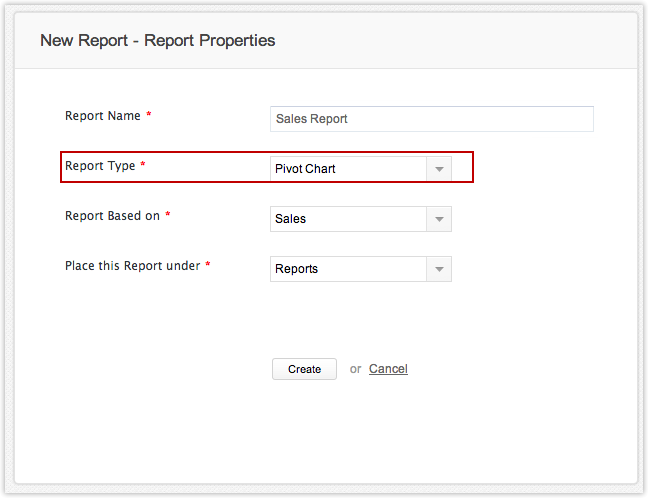
- Click on Create New option on the left and select Report.
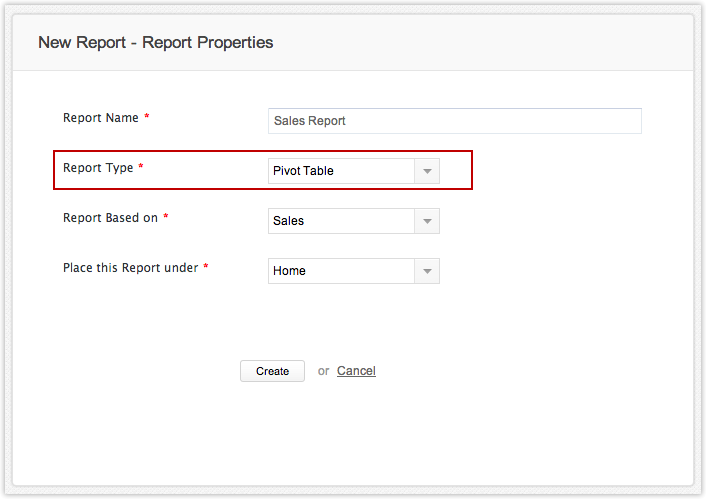
- Specify the Report Name and select the type of report as Pivot Table from the dropdown list.
- Select the form based on which the report is created and the location where the report must be placed.
- Click on Create button to create the report or Create and Customize button to create a customizes report.
- You will be taken to the Report Builder screen.
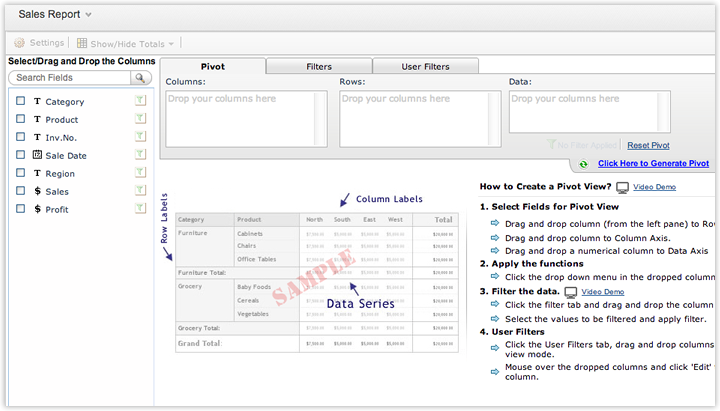
You can now start creating your Pivot View by simple drag-n-drop of the fields from the left-pane into the design area on the right, to construct the pivot table.
2. Select the fields for the pivot view
- Drag and drop the required fields (from the left pane) to Row Axis
- Drag and drop the required fields (from the left pane) to Column Axis
- Drag and drop the required numerical fields to Data axis.
Note:
- Multi-level pivots can be created by specifying multiple fields to the column, row and data axis, as shown in the screen-shot below.
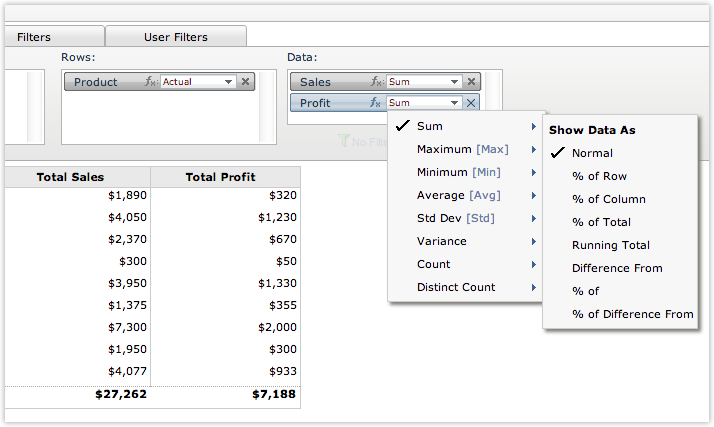
3. Apply the functions
In the fields dropped, you can click on the drop-down menu and select the appropriate function. For example, in the screen-shot given below, the functions supported for the Data fields are listed in the drop-down menu. The Sum function will be selected by default.
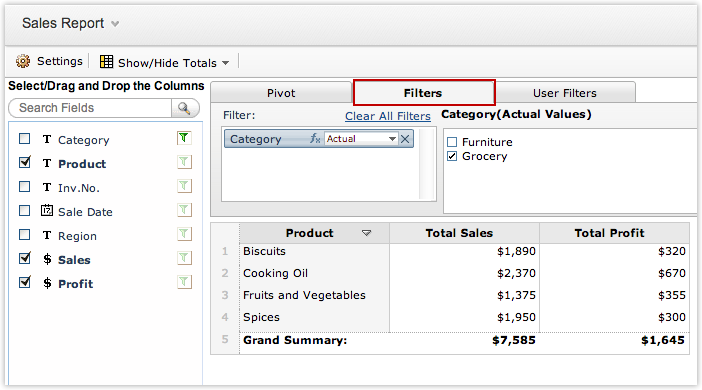
4. Filter the data
You can create filtered Pivot tables using the Filter tab. Refer the section Filter data on any column for more information.
5. Generate the view
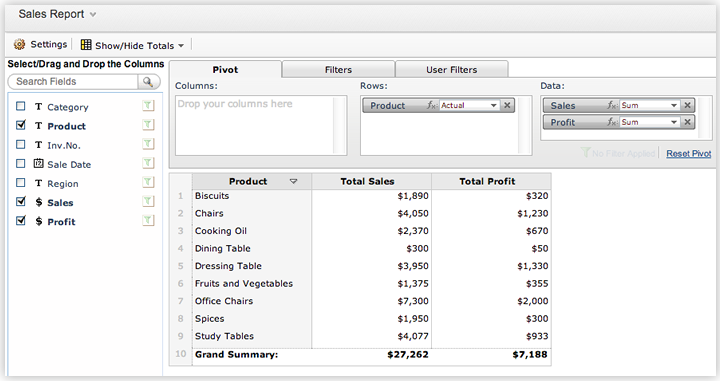
Click on the Click Here to Generate Pivot to create the pivot view (or) click on Done to generate the pivot view. The screen-shot given below displays a pivot that shows Total Sales and Profit region-wise, splitting it further by Product Category and Product name at the Row level and Region at the column level.
Creating a Pivot Chart
Pivot charts enable you to visualize data in multiple chart formats.
1. Steps to create a pivot chart
- Click on Create New option on the left and select Report
- Specify the Report Name and select the type of report as Pivot Table from the dropdown list.
- Select the form based on which the report is created and the location where the report must be placed.
- Click on Create button to create the report or Create and Customize button to create a customizes report.
- You will be taken to the Report Builder screen.
You can now start creating your Pivot Chart by simple drag-n-drop of the fields from the left-pane into the design area on the right, to construct the pivot chart
2. Select the fields for the pivot chart
- Drag and drop the required fields (from the left pane) to X-axis
- Drag and drop the required fields (from the left pane) to Y-axis
3. Apply the functions
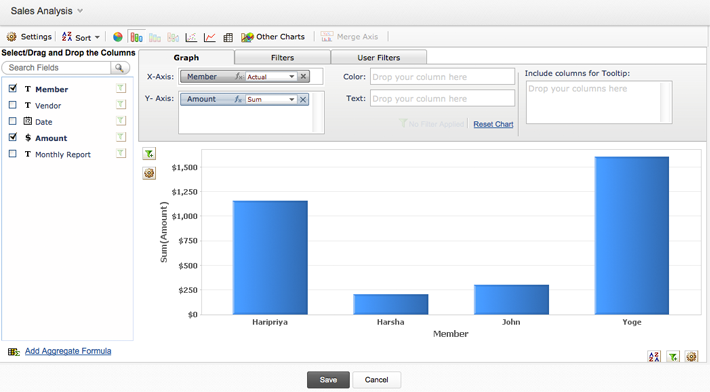
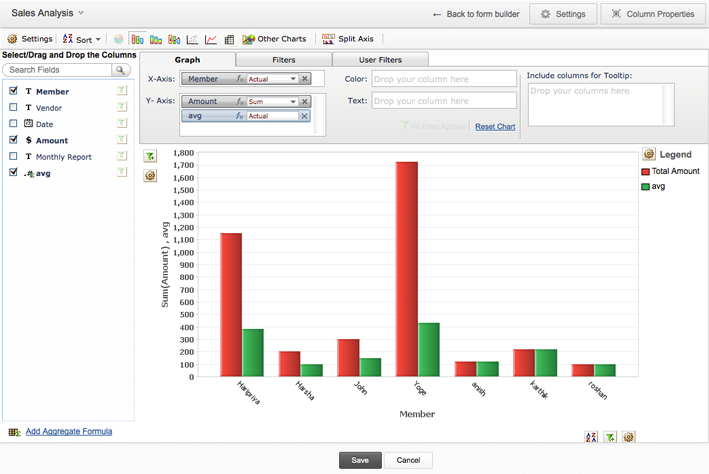
- In the fields dropped, you can click on the drop-down menu and select the appropriate function. For example, in the screen-shot given below, the functions supported for the Data fields are listed in the drop-down menu. The Sum function will be selected by default.
Click on the Click Here to Generate Graph to create the pivot chart (or) click on Done to generate the pivot cart. The screen-shot given below displays a pivot chart that shows Average Sales and Average profit for each region.
Filter Data on any Column
You can create filtered Pivot tables and charts using the Filter tab.
- To create a filtered pivot view,
- Click on the Filter tab and drag and drop the field(s) whose values are to be filtered, to the Filter axis.
- The actual values of the field will be displayed in the Actual Values axis. Select the values to be filtered.
- The selected values will be added to the Include Items axis.
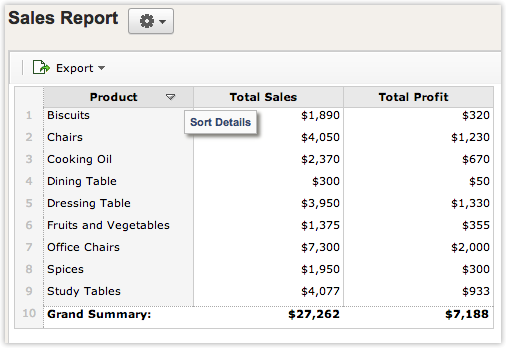
Sort Data on any column
Zoho Creator also lets you sort data on any column in your Pivot table. You can use the sort icon displayed near each column header or right-click on any column and apply the appropriate sort option.
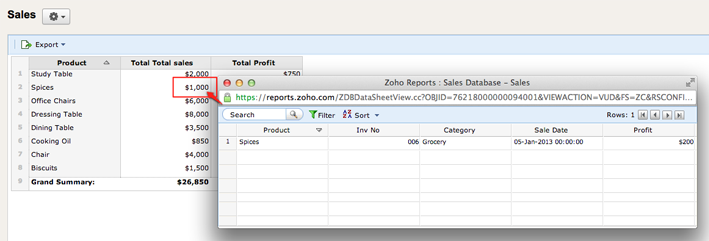
View underlying data
Want to drill down into what each cell in the pivot table / pivot chart represents? Say you want to know who bought Office Chairs when and for how much. You can click on the relevant data point in the pivot table and see the underlying data. The screen shot shows all the sales that has happened for "Office Chairs".
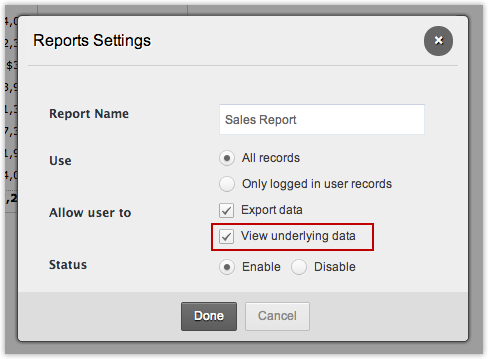
Enable shared users to access the underlying data
By default, shared users will not be able to access the underlying data.
To allow shared users to access the underlying data:
- Click on the Settings icon displayed on the top.
- Select the checkbox View underlying data and click Done.
Manage Reports
All your reports will be listed in the Reports tab with the unique name of the report, the report type and the view based on which the report is created. You can also view and edit existing reports, delete reports that are obsolete, rename reports and set e thstatus of a report as enabled or disabled, right from the Reports tab.
- Edit Reports - Click on the name of the report to edit a specific report.
- View Report - Click on the Access Report link to view the report.
- Duplication Report: Click on the Duplicate link to create an exact copy of your existing report. This feature will be useful if you want to create new report similar to the existing report, but with minor changes to configurations.
- Delete Report: Click on the delete icon placed next to the Status of each report, to delete the selected report.
Embed Report in Website/Blog
You can embed the Report in your website/blog just by pasting few lines of code.
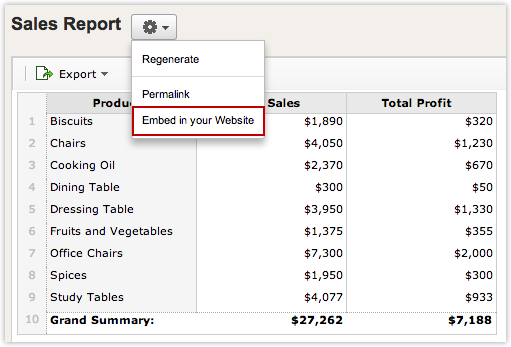
To embed a report,
- Access the report and click on Settings icon -> Embed in your website from the Report header.
- The Embed dialog will be displayed with the <iframe> code. If your view is private, users will have to login to access your embedded report. To access the repotr without login, select the Click Here link. You will now find an encrypted code appended to the existing url.
- Copy and paste the code snippet to your website.
Get Permalink of Report
Use the Report permalink if you do not want to share your report with users but just want to send them a link to view the report data or to link the report in your website/blog.
To get the permalink of a report,
- Access the report and click on Settings icon -> Permalink from the Report header.
- Copy/Paste the permalink to your website/blog or send it to people who would like to access the report.
Note:
- If your report is Private, the permalink will prompt for login details. To get a permalink which does not require login, use the Click Here link displayed in the Permalink dialog. You will now find an encrypted code added to the permalink. Use the encrypted permalink to access the report without login.
To use more advanced reporting features available with Zoho Reports, refer the link Reporting on Zoho Creator applications using Zoho Reports.
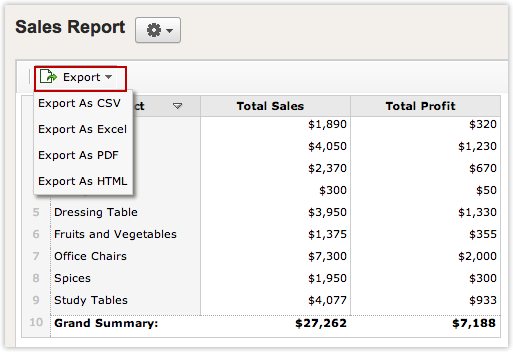
Export a Report
You can export a report as CSV, XLS, HTML or a PDF file using the Export option as shown in the screen-shot below.
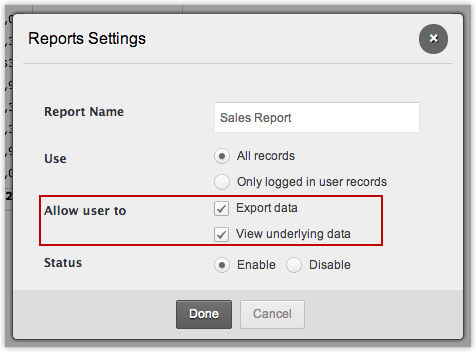
Enable shared users to access the export option
By default, shared users will not be able to export data. To allow shared users to export data,
- Click on the Settings icon displayed on the top.
- Select the checkbox Export data and click Done.
To use more advanced reporting features available with Zoho Reports, refer the link Reporting on Zoho Creator applications using Zoho Reports.
Limitation
Multi-select / Checkbox field types cannot be used to create reports.